Prototype: new version of the sleepyBoard!

The sleepyBoard is an Arduino-ready prototyping board that makes it easy to build your own Arduino with a boot-loaded ATmega and a few other components. It is, however, not IC specific meaning you can use it to prototype many different circuits. It's also the perfect size for an Arduino shield (see details).

This is the 3rd version, which moves the IC area from the lower part of the PCB to the center. I primarily create these for classroom use but I also use them in my own work. If you're interested in purchasing some, let me know! I'll be manufacturing the first run later this summer and I'll have some for sale on this site after that. Detailed instructions will be included. 
Roulade

I've been wanting to try out 3D printing in various metals so I designed this bracelet and printed it in polished grey steel.

A few of the exciting projects from the spring Device Invention class

It was a packed semester with students working on three distinctly different electronic projects. This year's Device Invention class started with the creation of a device that speaks, or is communicated with, wirelessly. Students were encouraged to think of wireless technology as a modern form of magic that allows an invisible stream of information pass short or long distances. Here are a few of the projects:

Max's Lunar Clock connects to a weather api to represent the current moon cycle.

Lois's Internet-controlled tea infuser. The steep time can be adjusted via a web app.

Kapp's martian weather monitor used NASA's mars rover API to get the current conditions. 

Sydney and Leo made an internet connected mirror that gives you the time, weather, NYT top stories and upcoming muni buses.

Nichole's project uses an LED ring and the international space station API to indicate when the space station is within the latitude and longitude of the Bay Area.


The second project asked students to collect and visualize data. The goal was to think about what data could be collected and then presented in a way that tells a hidden story. What can we see in the data that we could not see before? Some examples:

Pauline, Kelby and Nichole's interactive visualization showing people entering the school over the course the day.

Isaac, Matt and Erik visualize current over time from different custom made batteries. Each of the three circles represents a different amount of weight placed on top of the aluminium-graphite batteries, as determined by the width of the circles' diameter.  The lines that go outwards represent the current output over time.  To read time, start from the the top and go clockwise just as if you were telling time on a standard analog clock.

Luca and Harrison visualize the temperature variation across neighborhoods.


The final short project was to design a portable solar device. The device could be a light, portable charger, or something else that can be run on 2 to 5 watts of solar generated energy. An couple examples:

Kelby's 2-watt portable solar battery pack with USB charging ability.

Ellie's 3.5-watt portable solar battery pack with USB charging ability.

New Piece: Welcome Drone

I had the idea for this object two years ago when I first learned about the dronestre.am website by artist Josh Begley. I've iterated on various versions but this is the one that feels complete. Welcome Drone uses the internet of things methodology to bring the reality of secret drone strikes into the home and into casual conversation. Once an hour, a photon microcontroller checks to see if there are updates on the dronestre.am site. If there are, the unit glows for 8 hours continuously. Because there's nothing about the piece which indicates its meaning, it blends into the home like any other wall hanging artwork or decor. When it does unexpectedly light up it may serve as a reminder or conversation starter about the secret strikes that are taking place on a regular basis in Pakistan, Yemen and Somalia.

New Piece: SMS Cross stitch

I started a year ago and I finally finished it. A mash-up of wireless technology and craft aesthetics, this piece turns a text message into an instant display of digitally-sewn wisdom. It all runs from an openFrameworks sketch on the Raspberry Pi. Incoming SMSs are handled by the FONA module. See a demo here.

Number Fog Design Installation and Fashion Show!

Here are some images from the August 26th Gray Area Creative Code Fellowship exhibition:

Outfits designed and sewn by Alice Clifford (left) and Timothy Ho (Right). Sam B. models Tim's creation

Fabric installation with demo video.

Sam B. models outfit design by Timothy Ho in front of fabric installation and demo video.

Joseph Burg models "$900 tent" suit. Sewing coordination by Mai Nguyen Hart.

Mel shows off "Mission Condo" dress in front of the condo that inspired the design.

Alice Clifford, Myself, Joseph Burg, Youssou Fall, and Mel. Alice Designed and made her outfit all other sewing in this image coordinated by Mai Nguyen Hart.

Lindsey Irving dons "wearable tech fist bump" wraparound as she catches up with Eric Rodenbeck of Stamen.

Matt Ganucheau and Rachel Weidinger show off outfits at the exhibition. Outfits created by Rachel.

This project was sponsored by Gray AreaStamen DesignBritelite ImmersiveObscura Digital, and Presence Product Group.

Creative Code Fellowship Update: Week 9

This week's focus has been on the August 26th event. The following items are all in progress:

  • One dress from the Mission Condo design is complete! (Thanks to the help of Mai Nguyen and her friend May).
  • My long time friend Alice Clifford is making a dress from the Buses fabric to wear to the show.
  • I have leads on a jacket and pants -  from the $900 tent design - which I would wear to the show.
  • I may have a lead on one or two men's button-up shirts. One would be from the Transport Unity design and one from the Wearable Tech design.
  • I'm very excited to be working with CCA graduate student Timothy Ho. He's designed a complete outfit and has a model lined up for the show. He wants to create an outfit that highlights all the designs. One element of the outfit will use a patchwork design which is not an uncommon application of block-print fabrics. This is the  patchwork configuration he will be working with:
  • I am almost finished with the wood display rack (displayed in the previous post) and am working on a tag for each design that will give information on theme and and data.
  • A website that has information about the designs is mostly compete.

What do I still have questions about?

I'm still unclear what the life of these fabrics should be moving forward. What kind of control, if any, should I maintain over their use and distribution? Should I open the designs up for anyone to purchase and do whatever they want? Or, should I try to partner with a local tailor to curate the items created? At this time, I'm leaning to the later but have not yet found the right person to work with. 

Creative Code Fellowship: Week 8

I now have 8 printed designs with a 9th on the way! I'm backing off the design process for now.


This week has been about:

  1. Making connections to get things tailored
  2. Thinking about the installation for the Gray Area August 26th event
  3. Working on a website to inform interested parties about the ideas in each design

I have one dress in progress and a lead on a possible jacket / pants combo and men's button-up shirt. I'm also super excited that my friend Alice Clifford wants to make a dress and wear it to the event. I'm equally honored to be working the CCA fashion/textiles grad Timothy Ho. His designs are awesome and I'm dying to see what he'll do with some of the fabrics.

I created a design for a freestanding display that I'm thinking of building for the Gray Area event. I'll present it at the weekly review tomorrow and see what feedback I get:
 

I have an information website in progress. There's still a lot of work to do on it, but this is where it's living for now: http://numberfog.com/

Creative Code Fellowship Week 7: Almost ready for the Needle

I’ve been dialing in my Processing and openFrameworks pattern making tools. I’ve also been making some conceptual cuts in terms of how many themes I can use, mainly on the basis of which symbology is the strongest. These are designs that I will most likely print:

Clipper >>>>>>>Data represented at yellow arrows: Traffic volumes at regional (freeway) gateways >>>>>>data source

Mission Street Condo >>>>> Data, represented as inverted dot graph: Quarterly San Francisco Median Home Values 1990 - 2014 >>>>>  data source 

Street Vending / Coding Mash Up: HTML Frozen Treats >>>>> Data, represented as droplets from left to right : Quanity of people claiming food insecurity in the Bay Area 2001 -2013 data source + Data, represented as dot spiral : Mobile food vending permits issued in San Francisco >>>>>  data source

Drone >>>>> Data, represented as stars: Close calls between pilots and drones reported, by state, to the FFA in 2014. California is the largest of the stars with 25 "close calls" reported. >>>>>> data source

$900 month Tent >>>>> Data, represented as magenta lines: San Jose Average monthly rent 2009-2015  >>>>>  data source.

Based on this

One of these is a maybe:

Car Services of San Francisco >>>>> Data represented as sine waves: Wage growth, by race/ethnicity, comparing 2000 to 2012. Every two lines, starting at the top, represents a race/ethnicity: White, Black, Latino, Asian/Pacific, Native American, Other. >>>>> data source

Car Services of San Francisco >>>>> Data represented as stars: Wage growth, by race/ethnicity, comparing 2000 to 2012. Every two start, starting at the left, represents a race/ethnicity: White, Black, Latino, Asian/Pacific, Native American, Other. >>>>> data source

I have finished fabrics coming of these 4 designs (3 yards each):

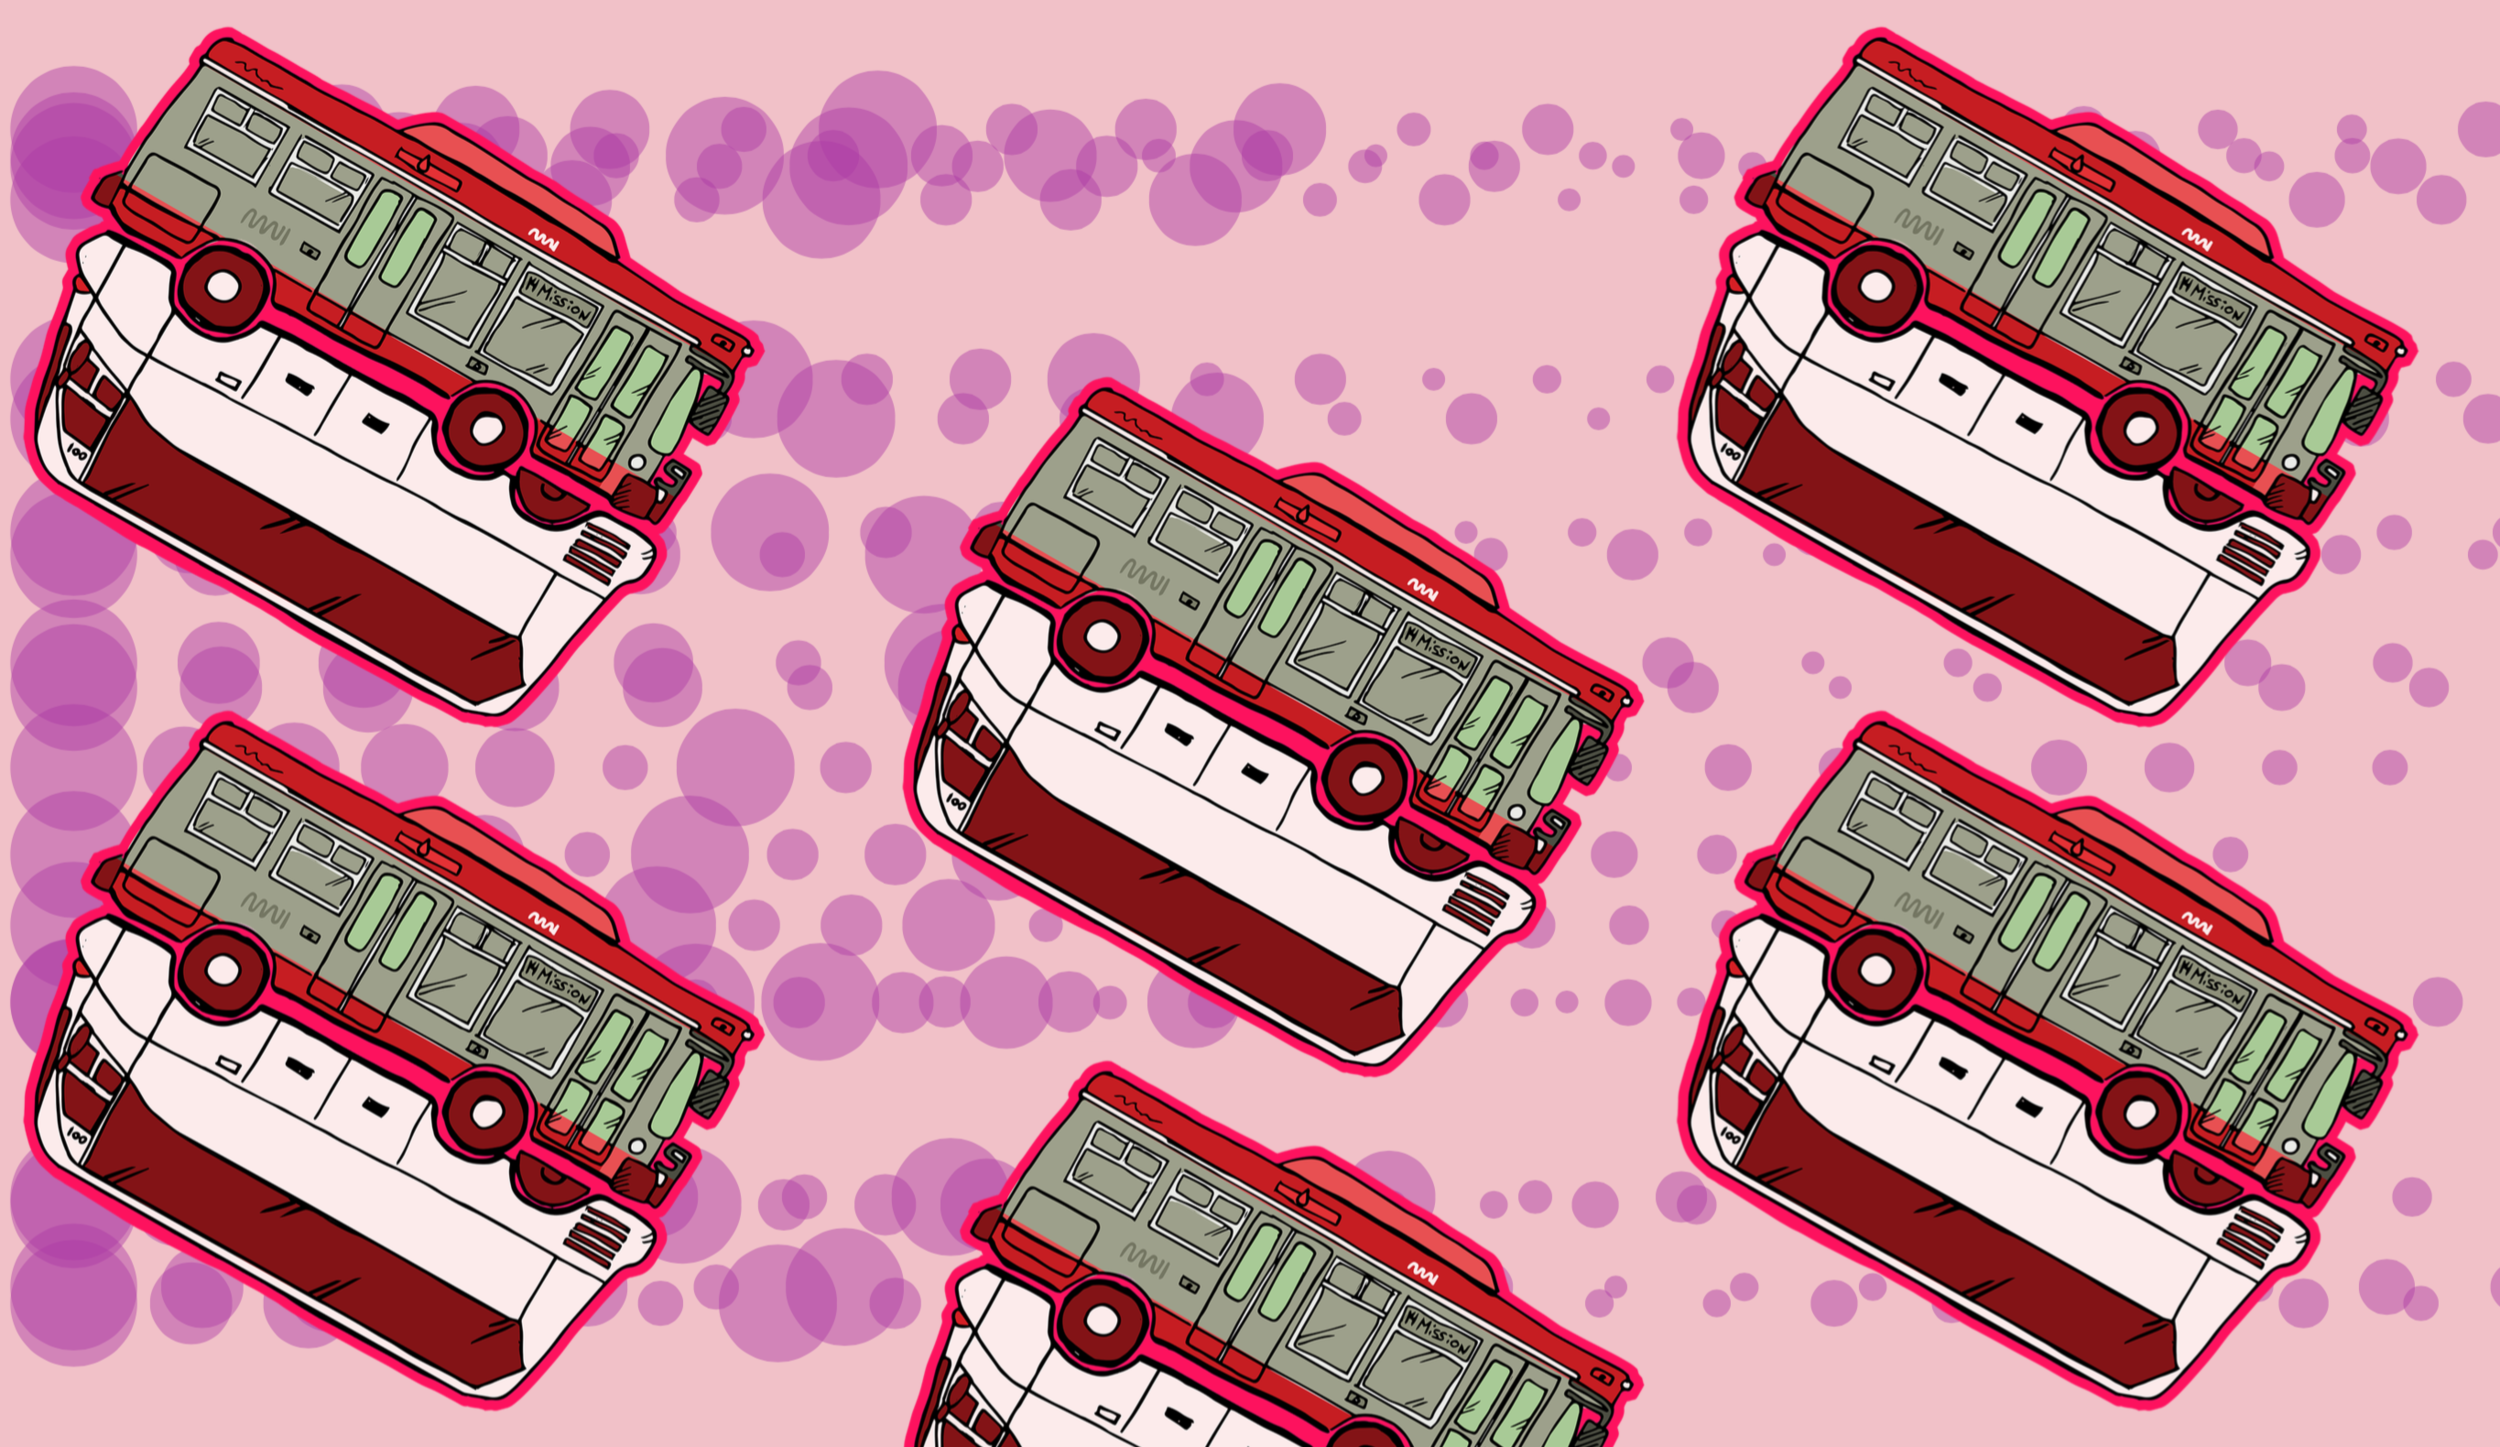
Buses of San Francisco >>>>>> Data, represented as circles from left to right : Gender and diversity data from 6 major Bay Area tech companies. Rightmost data: San Francisco ethnicity breakdown according to 2013 US census data  >>>>>> data source

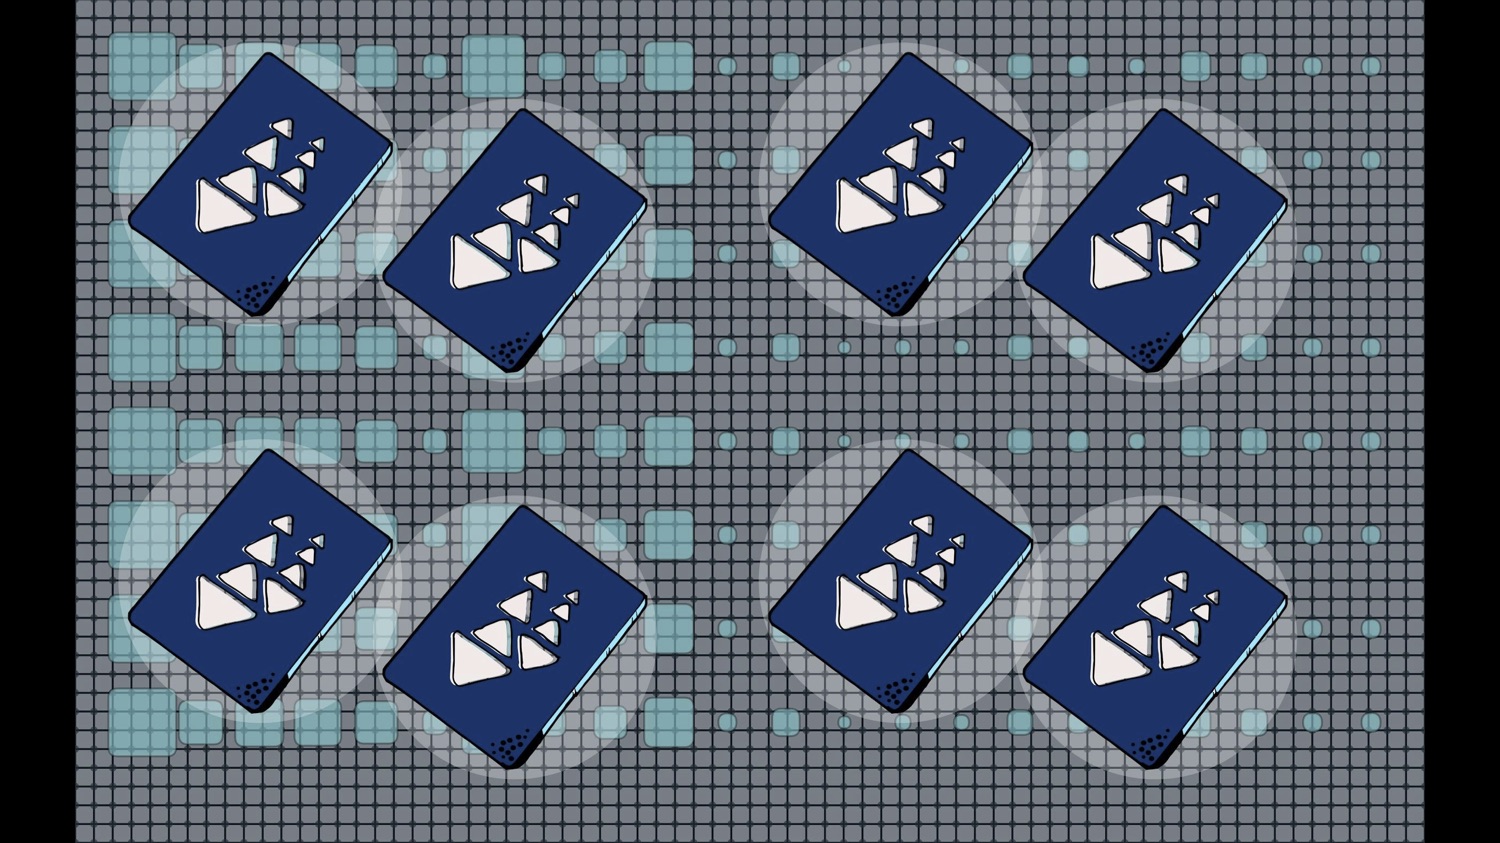
Street Vending / Coding Mash Up: CSS Tamales >>>>> Data, represented as polygons from left to right : Average Hourly wage for 22 San Francisco occupations as defined by the Bureau of Labor Statistics  >>>>>  data source

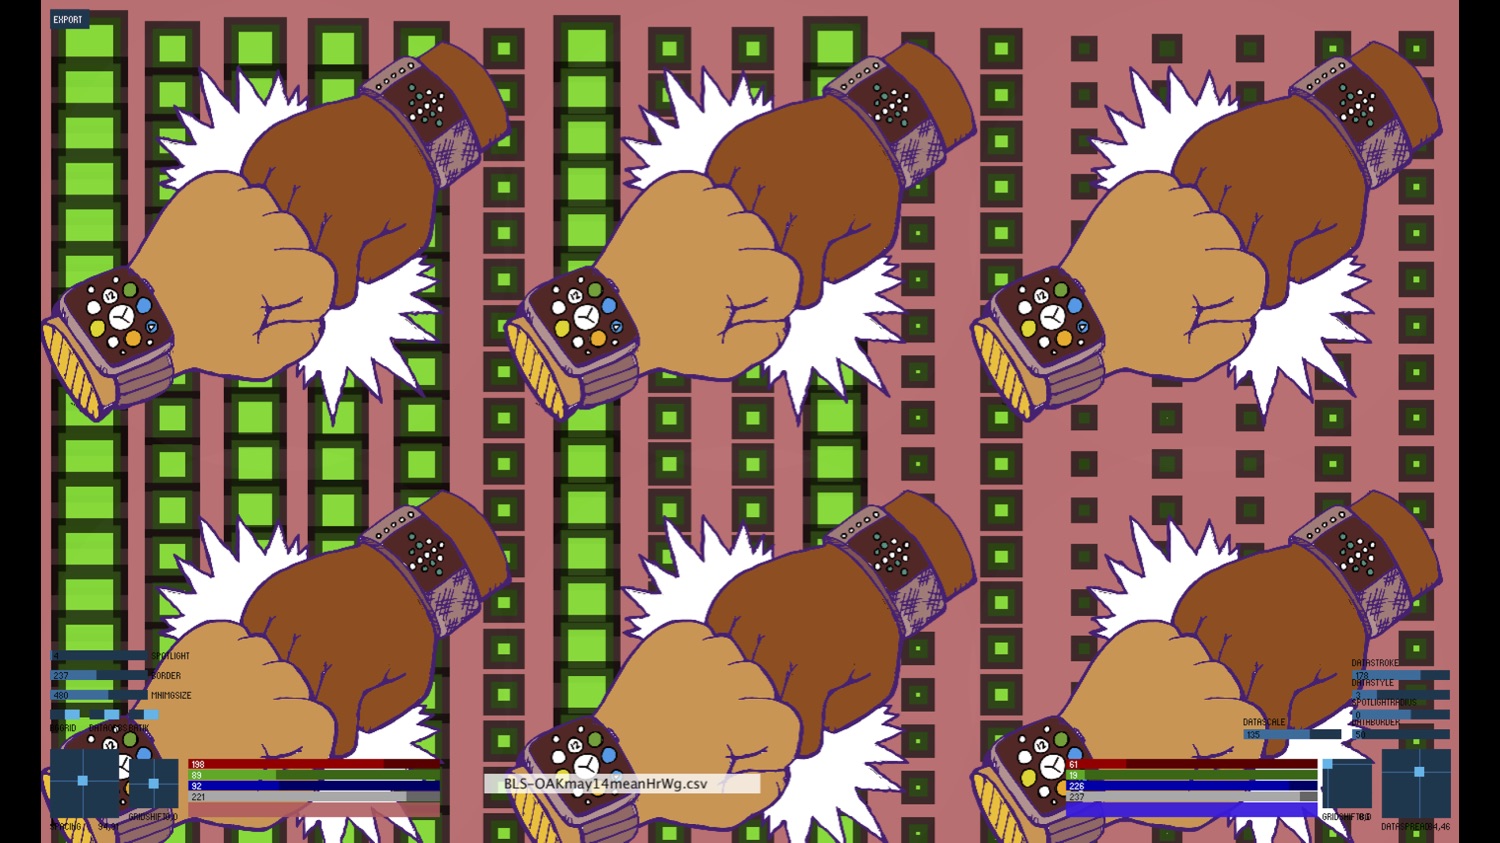
Wearable Tech Fist Bump/Battle >>>>>> Data, represented as hearts from left to right : California quarterly E-waste intake by private companies (in millions of pounds) from 2005 - 2015 >>>>>>  data source

Internet of Things / Environmental Data Monitoring Palms >>>> Data represented as pink circles of lines: Numbers of recorded tree species in San Francisco. data source

I’m ready for the final phase, which is going under the needle to turn these fabrics into wearable items. I’m going to approach this using a few different resources (while still looking for more!). I’m still uncertain of the final display but I’m considering asking a number of people to wear the fabrics and maybe not actually having a designated exhibit location. This is, however, only the latest of a stream of changing ideas.

Creative Code Fellowship Week 6: The Printing has Begun!

After receiving my second set of test prints, I was able to identify some issues with my software and perform some fixes (mainly that I had an almost invisible border - exported around each image - that was showing exactly where the repeat was happening!) I’ve now printed on three different fabric types (Linen-cotton canvas, Organic cotton sateen, and Organic cotton knit), and have determined that the organic cotton sateen, for its color vibrancy and feel, will be the most appropriate fabrics for my first official prints.

Top: $900 wifi tent on linen-cotton canvas. >>>>>Data: San Jose average rent from July 2009 - May 2015
Bottom: Mission Street Condo on cotton sateen >>>>> Data: San Francisco average rent from July 2009 - May 2015

The self-driving car races the California high-speed train.>>>>>Data: Number of people commuting alone in a car to Santa Clara county.

> Progress on tools:


While waiting for the test prints to arrive, I worked out a number of new parametric layout options, this is the latest version of my Processing design tool:

In an attempt to harvest more computing power for increasingly heavy image and data manipulation, I started building a second software tool in openFrameworks. At this point, it's still rudimentary but it has an operational GUI, loads images + data, and exports PDFs.

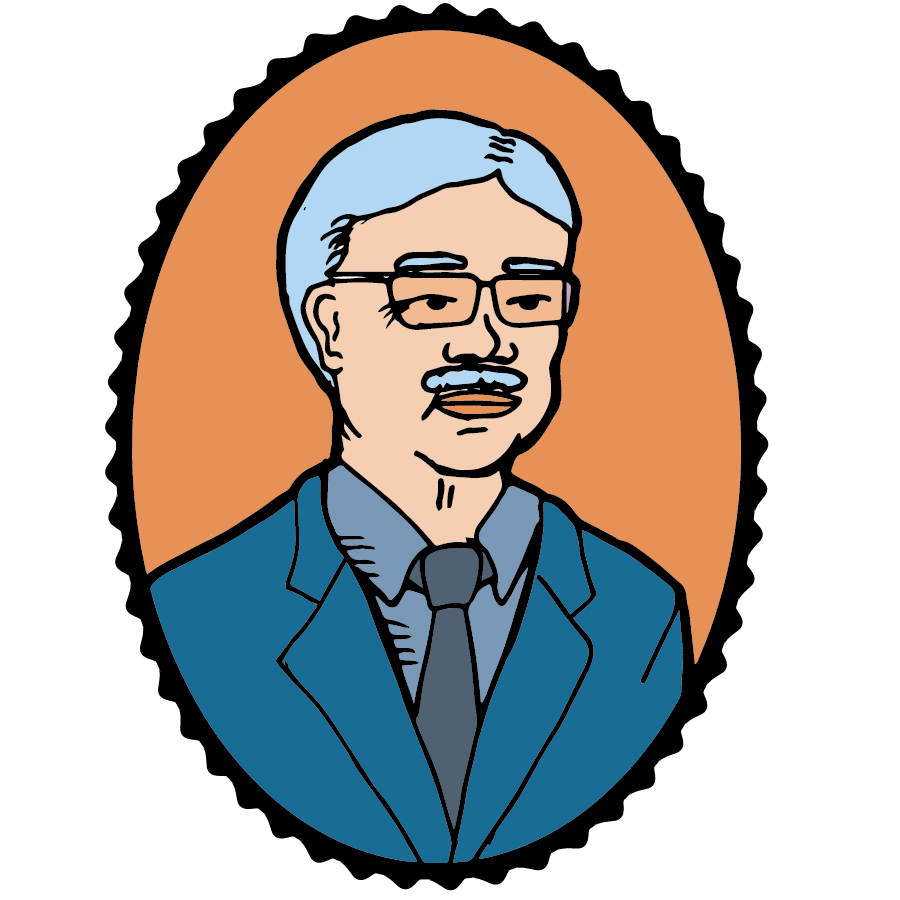
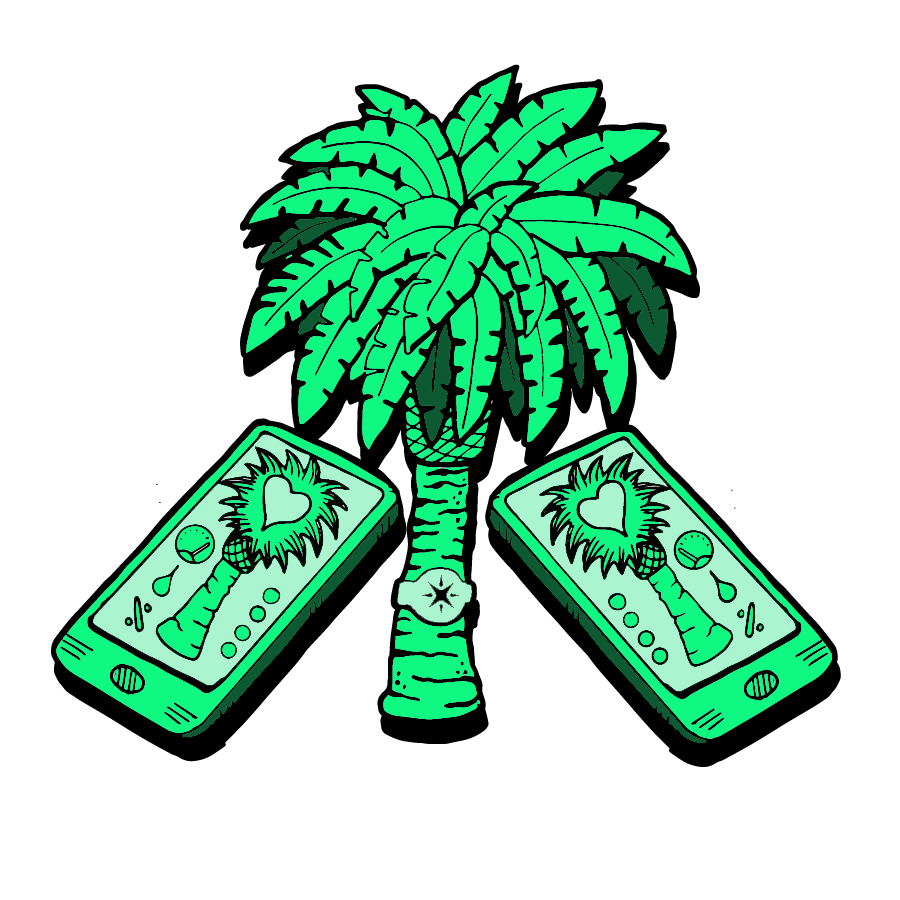
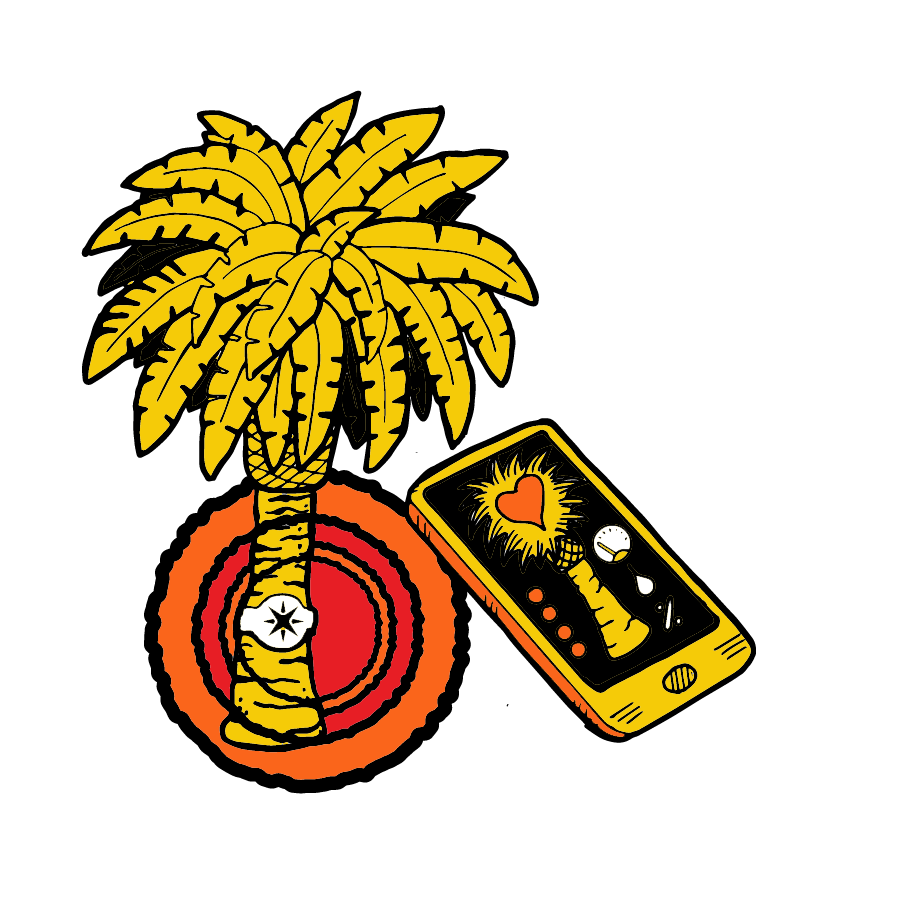
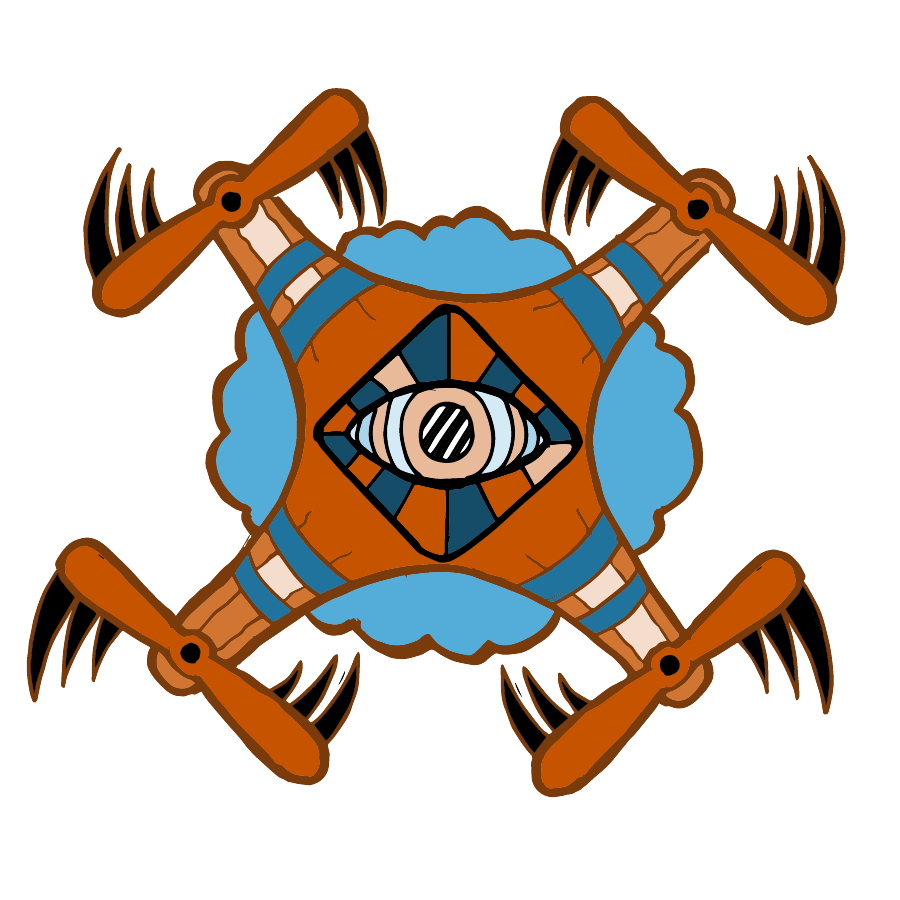
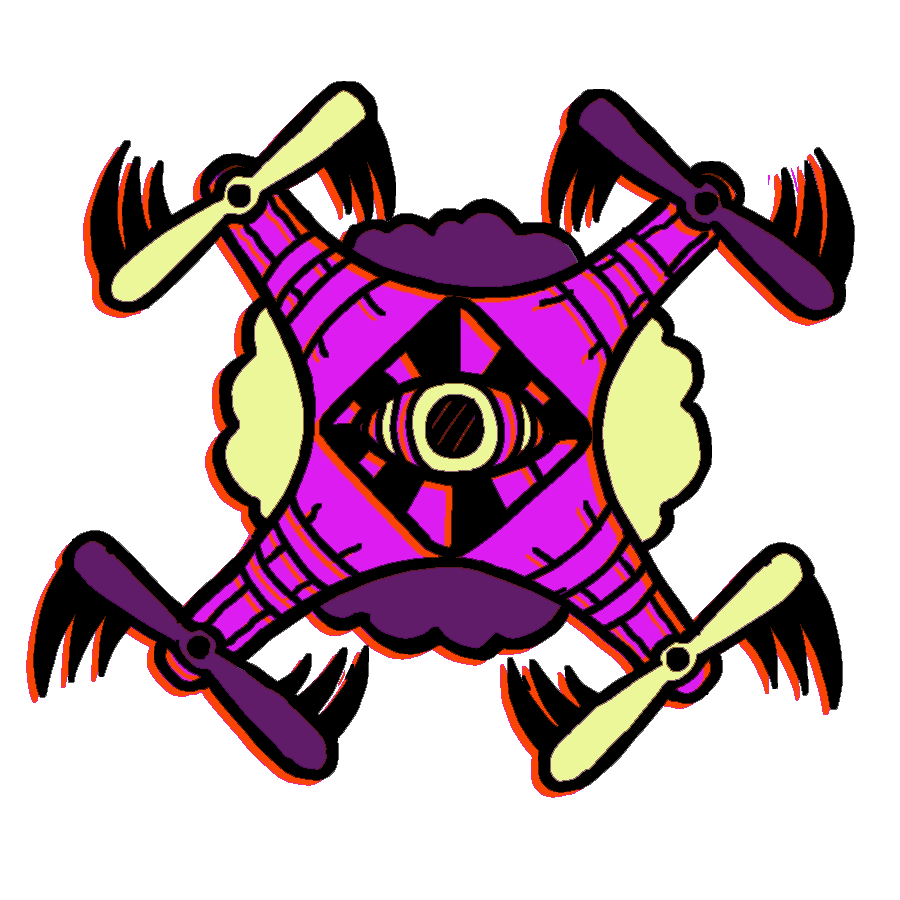
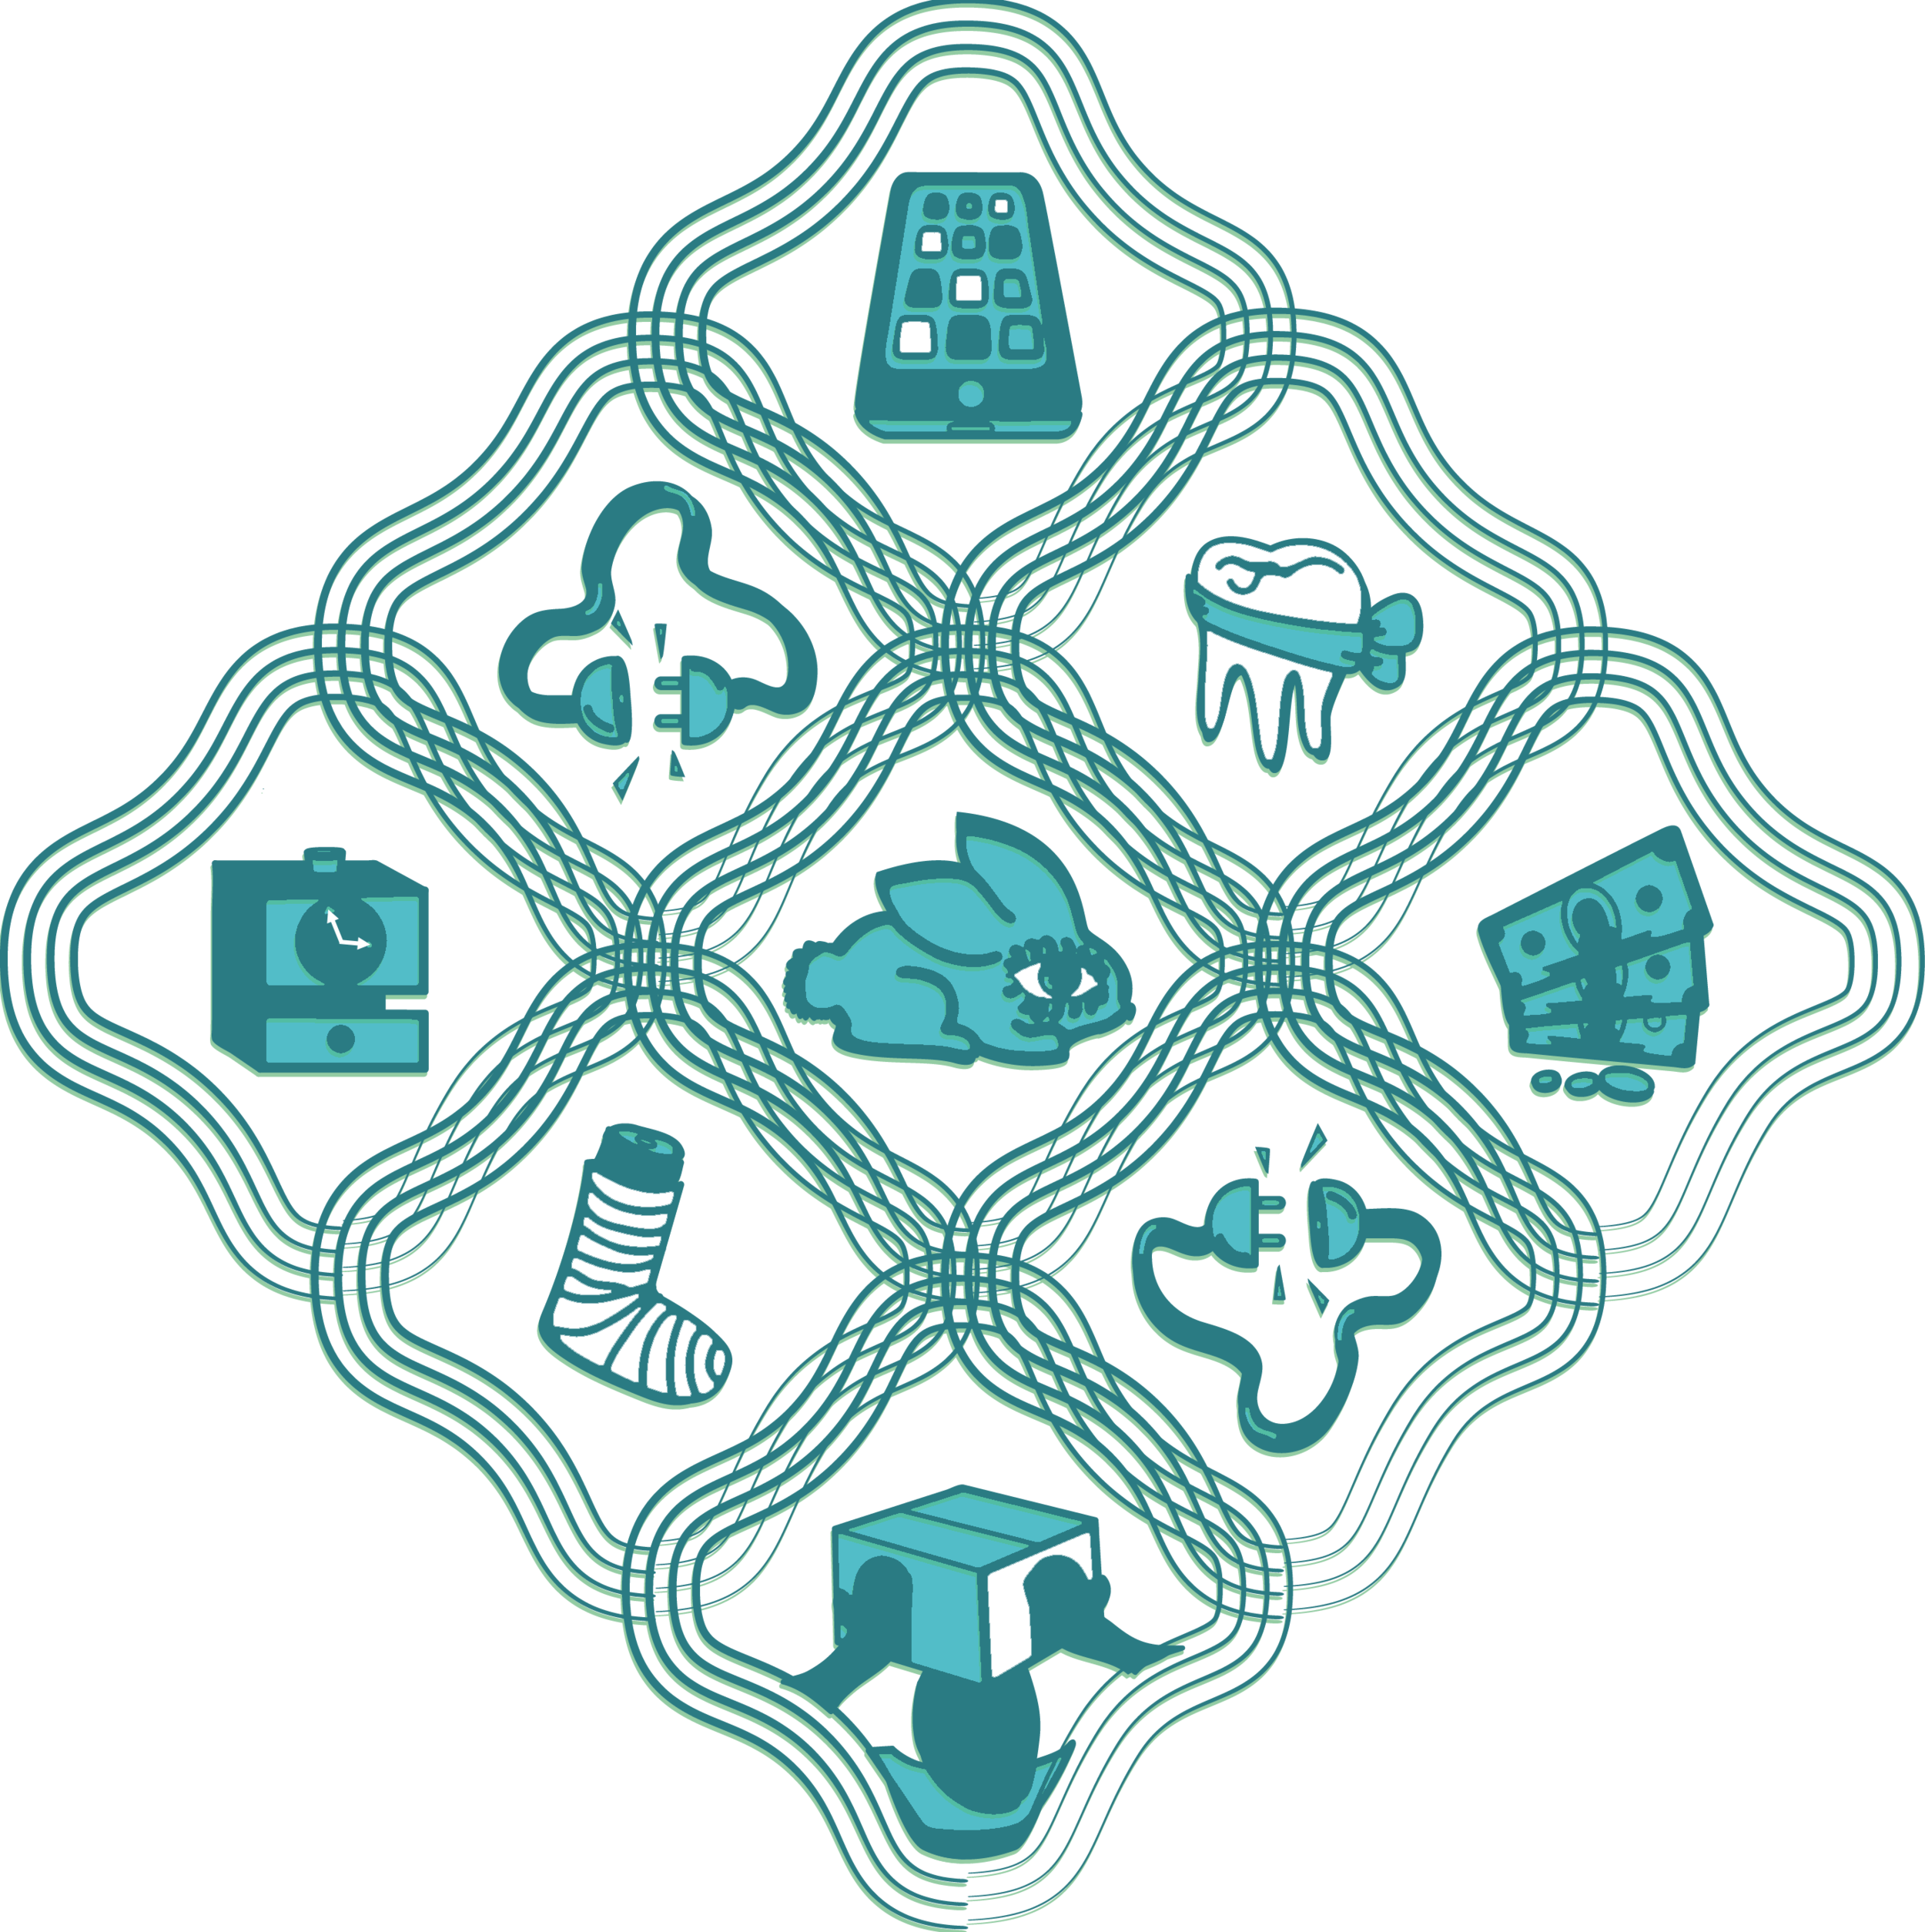
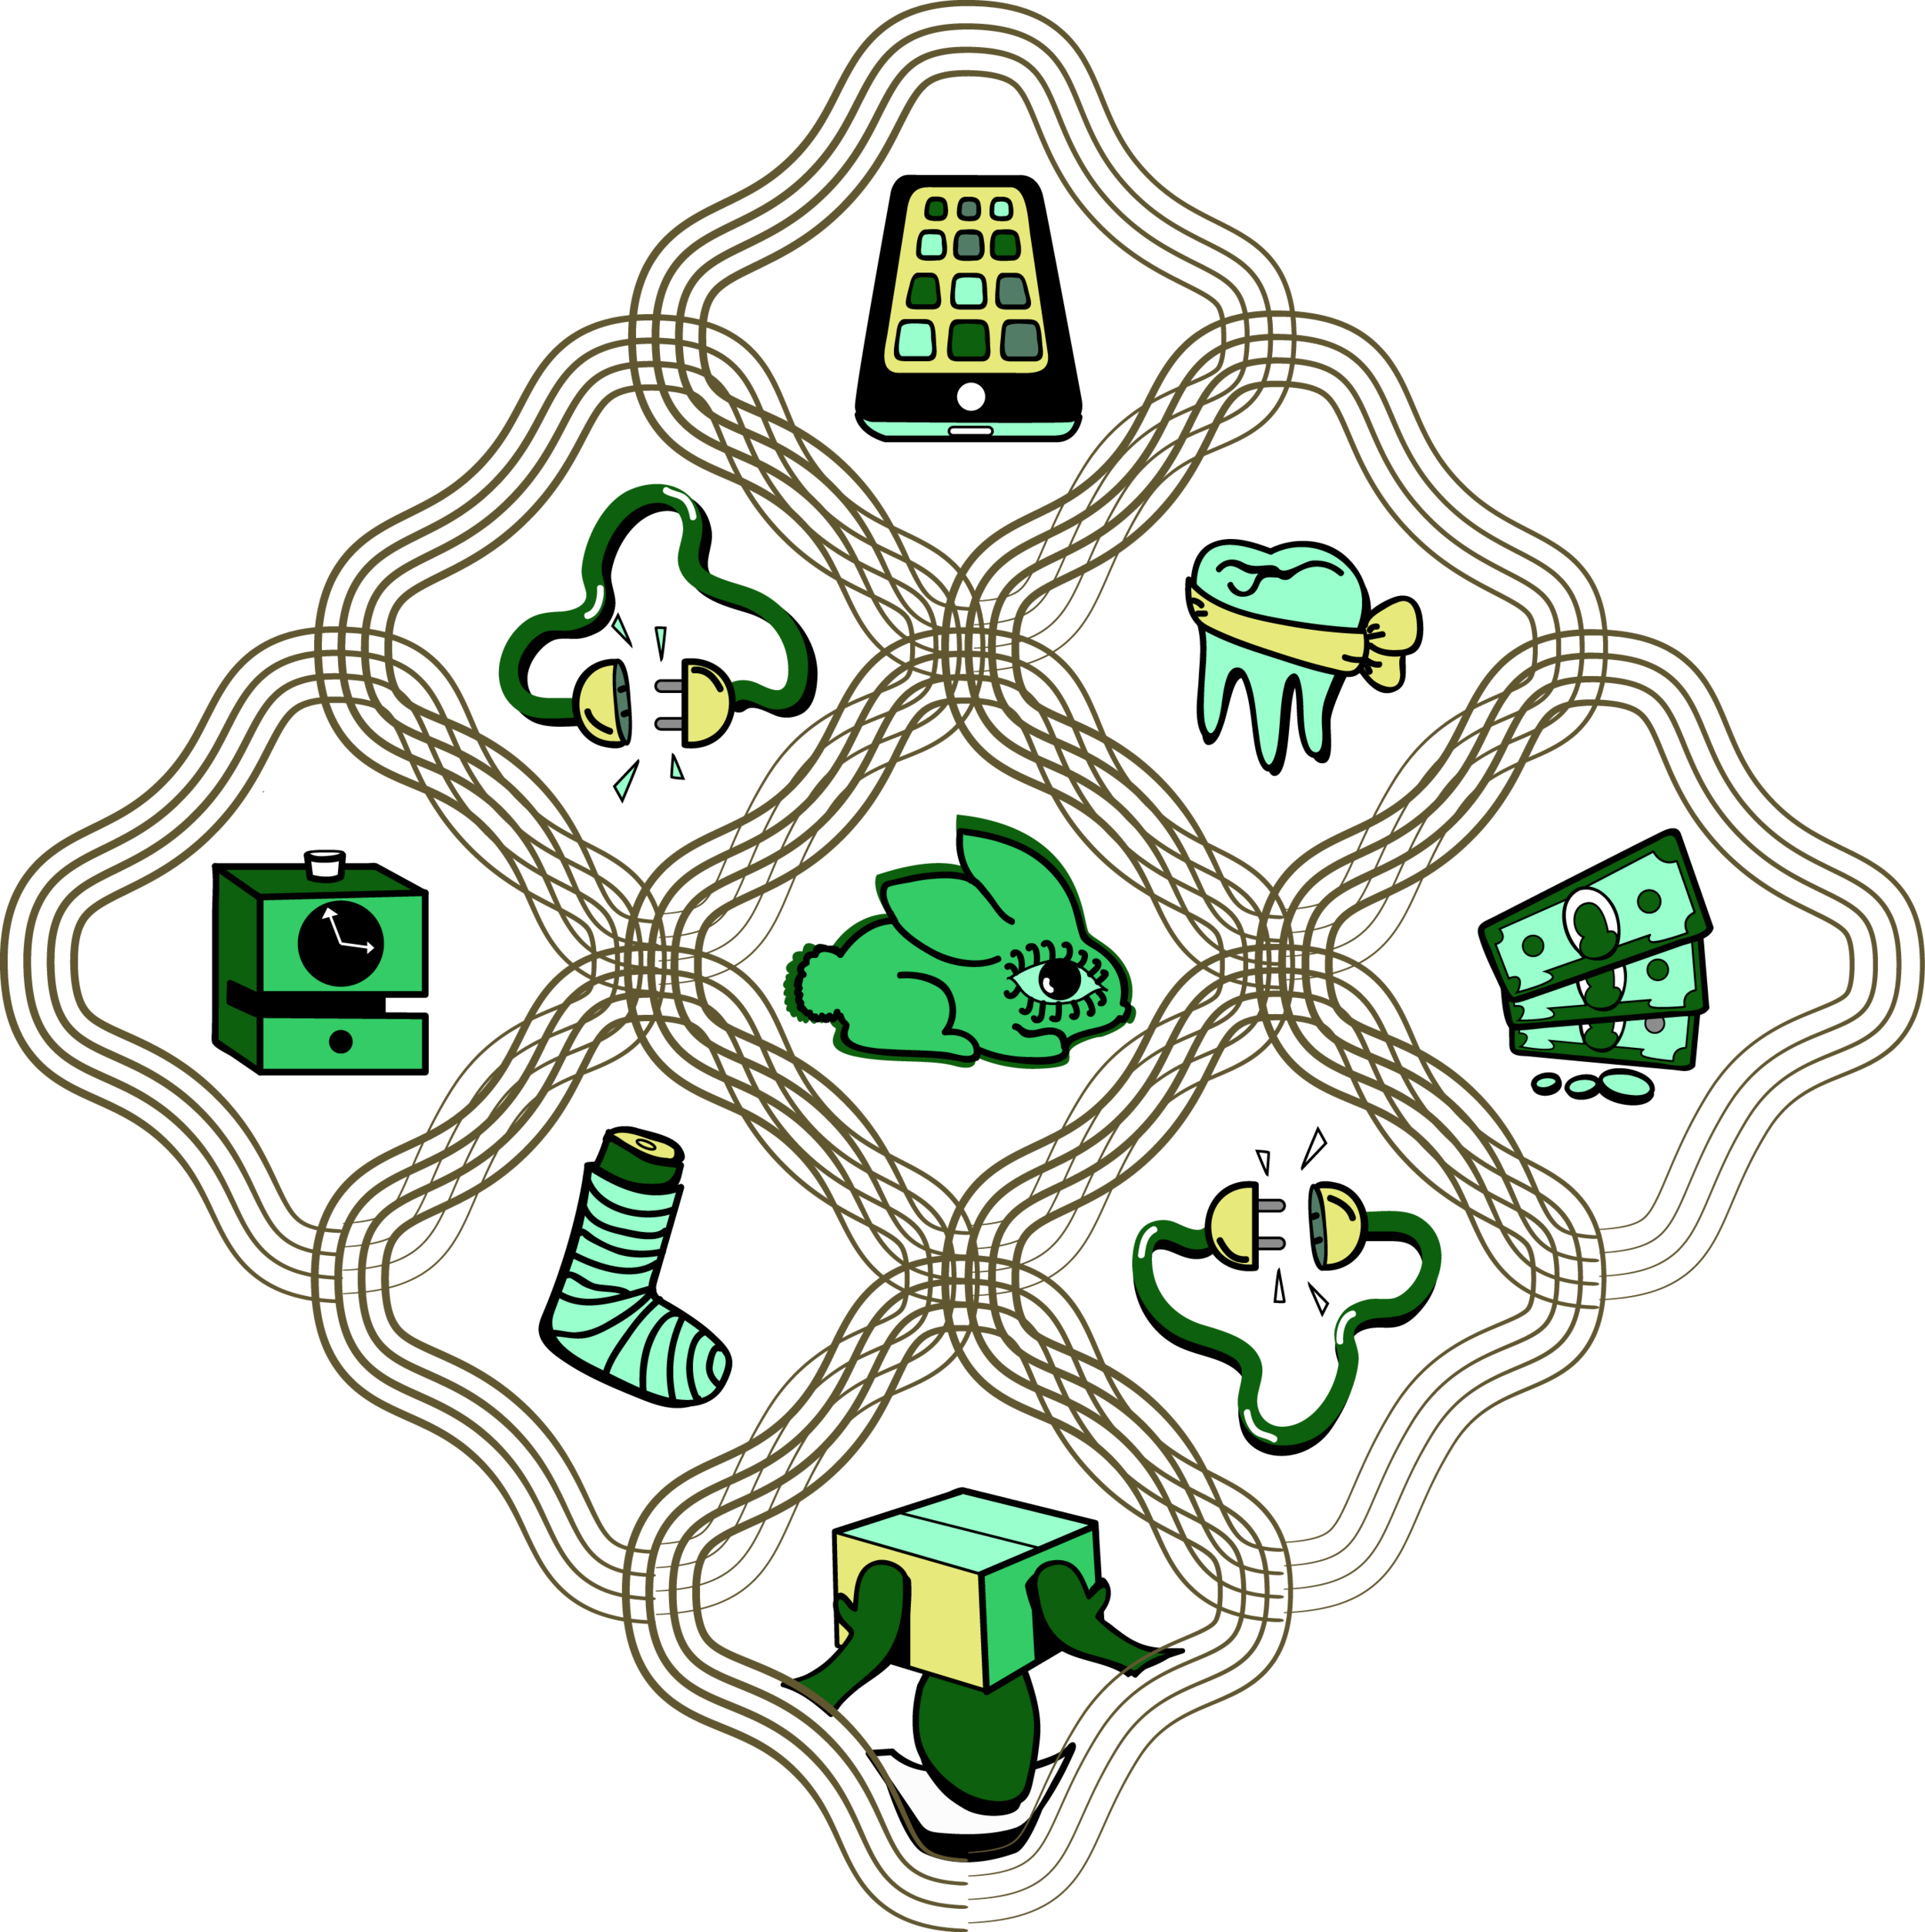
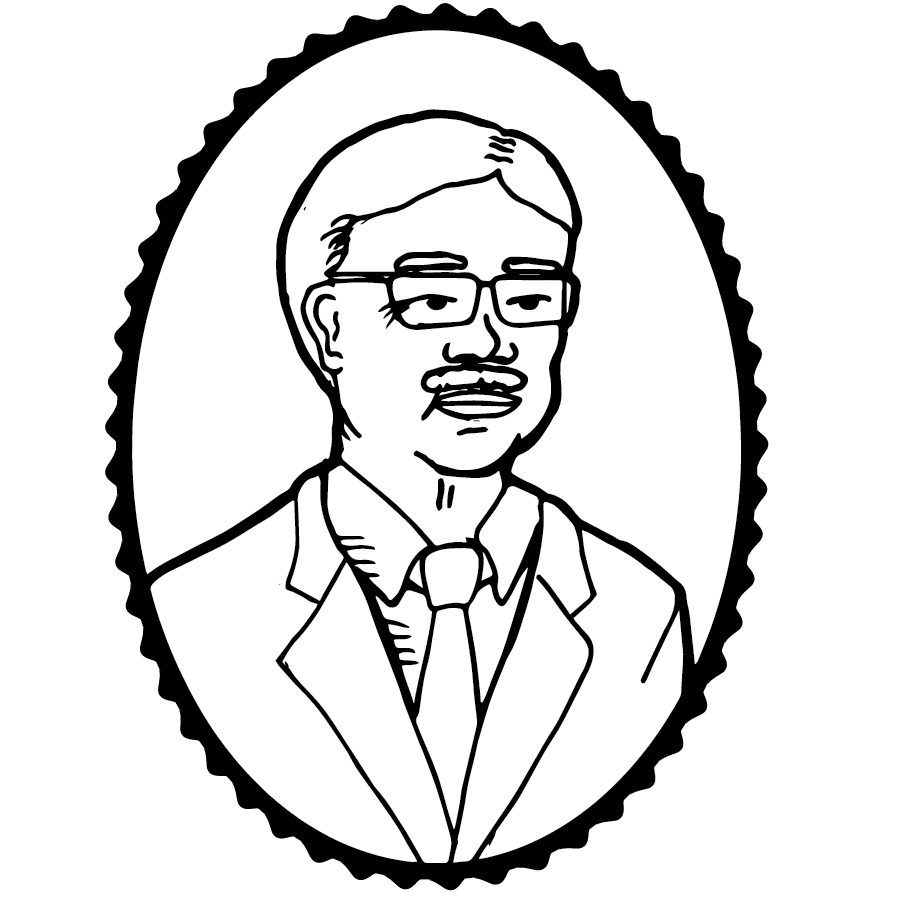
I’ve expanded my data options as well as my symbology. Some of the newest images (which I may or may not use), include: San Francisco mayor Edward Lee, a Quadcopter, and Internet of Things Palm Tree.

> Finished designs:

Wearable Tech Fist Bump / Battle >>>>>>> Data, represented as hearts from left to right : California quarterly E-waste intake by private companies (in millions of pounds) from 2005 - 2015. data source

Internet of Things / Environmental Data Monitoring Palm >>>>>>>>> Data represented as pink circle of lines: Numbers of recorded tree species in San Francisco. data source

(Design for test print only) Mission Street Condo on cotton sateen >>>>> Data: San Francisco average rent from July 2009 - May 2015

> NOW CONSIDERing:

  1. I want to make the imagery look more “block-print-like.” Only a few of the images have the look I want; I need to keep working the others.
  2. I'm thinking about more varied ways to represent and compare data sets.
  3. I still don’t know what I’m going to do with the fabrics. Here are the top ideas:
  • Work with local tailors to make 2 fairly standard men’s outfits (or at least shirts) and 2 dresses. Then display these items on mannequins or on live people. Potentially against a wallpapered backdrop (I did do a wallpaper test). There might also be a table with a cloth made of yet another design? I love the idea of mixing a variety of crazy clashing designs.
  • Display the fabrics on their own.
  • Work with a CCA fashion grad student  (assuming he still wants to) and see what we come up with together which will inevitably be on the wilder side.

> Just EXPERIMENTing:

Creative Code Fellowship Week 5: New Symbology

This week I focused on expanding the symbology collection available for the fabric designs. I expanded and refined the Mission vending / Web development mash-up series to include: Javascript burrito, D3 flower arrangement, CSS tamale, and HTML ice cream cart.

I expanded the competing transportation series, which now includes: Muni/Vanhool buses, App car service/taxi, and self-driving car / California high-speed rail.

I received my first fabric sample, with which I am happy, the only exception being color vibrancy. I believe this has to do with the porous nature of the organic cotton knit.

I've submitted three more designs which I am printing in larger quantity to see how the designs scale and tile. I am also trying two different fabrics and the lower design as wallpaper.

$900 tent with wifi. Data: San Jose average rents over the last 5 years.

Mission Street condo. Data: San Francisco rents over the last 5 years.

Self-driving car VS. California high speed train (race).  Data: Number of people that commute alone in their car from various Bay Area counties to Santa Clara county. The biggest orange box (which doesn’t even fit the frame) represents inner Santa Clara County commuters. 500,000 people commute alone in their car within that county alone!

Creative Code Fellowship Week 4: More complexity, more data

Most of my progress this week involved adding more complexity to the fabric pattern generation tool. There's still a significant gap between the harsh edges of the vector graphics and the organic look of the actual block print fabrics. I added some background textures, like a generative batik pattern that I think helps bridge this gap. I also added the ability to better visualize the data by printing the first 20 or so data points, as well as the title of the .csv file, at the bottom of the application window. I've added some rental and home value data to the mix.


I've contacted Recology to try to get some data on e-waste collection which I would like to incorporate into my design about wearable technology. This short video from TechCrunch reinforced my worries about the short life these technologies. I'm really looking to incorporate more data sources this coming week. 

I also have some new imagery that attempts to mash up web development logos with Mission vending (burritos, ice cream cart, flowers).

Background data: San Francisco average monthly rents from 2009 - May 2015 (data from RentJungle)

I also added the ability to combine multiple graphics:

Same data encoded in circular pattern.

Same data encoded in circular pattern.

Same data as sine waves.

My first sample fat quarter from Spoonflower comes tomorrow!


Creative Code Fellowship Week 3: meetings, frameworks, and A Fat Quarter

This was an exciting week for the Bay dataFabrics project. I've further focused my concepts and fabric themes. My current summary and public presentation is here. I had a productive meeting with CCA fashion/textiles graduate student Timothy Ho. We discussed a possible collaboration if I can stick to my fabric production timeline. I also had a lovely meeting with Allison Arieff of the amazing organization SPUR. Allison gave me some useful feedback and agreed that housing, transportation and labor are all top socio-political topics to discuss through the dataFabrics. I'm looking over a number of SPUR publications now and will likely ask specific departments for some data sets in a week or so. 

I've sent my first sample design to Spoonflower as a test. I'm getting a fat quarter of organic cotton knit with the clipper card design (below).

The processing framework is coming along and has many new features and as well as an expanded symbology. Notably new: The Fitbit/Apple watch fist bump and the $900 a month AIRBNB tent. Here are a few samples:


Creative Code Fellowship Week 2: Labor

For my first fabric design, I've chosen to build symbology and pull data related to Bay Area labor and income. I've focused my research on what I call "app-labor" but is more often referred to as the gig-economy. This is an economy based around on-demand hourly labor that is accesses through phone, tablet, or web applications. Most of the articles and debate seems to be around "odd-jobs" companies like Taskrabbit / Gigwalk / Zaarly and driving specific services like Uber / Lyft. I've been researching what people find attractive about these business models as well as what makes them the subject of intense debate. 

The idealist view:

“TaskRabbit aims to help people take back their lives, be their own boss, help people out, make some money and just feel good again.” (from Taskrabbit site)

The cynical view:

This "revolutionary" work built out of Silicon Valley convenience is not really about technological innovation – it's just the next step in a decades-old trend of fragmenting jobs, isolating workers and driving down wages. source 

Progress on my SYMBOLOGY:

I'm working on my symbology for this design. I want to create a symbology for both the Taskrabbit "odd-jobs" model as well as on for the Uber driver on demand model. Below: My progress on the former.

Note: The layout was inspired by this design. Thinking about: Connections and Disconnections, time vs. income, benefits (and lack of)

What about the data?

It could be most interesting to find data on some of the things that are "at risk" with this kind of work: Job Security, Benefits, Healthcare, Cost of Living, Labor Unions, hourly wages.
Right now I'm mainly looking at Bureau of Labor Statistics Data: Income, Occupational Data

Quick viz of mean hourly wages for the 22 occupational categories defined by the BLS (May 2014).

Some of my questions:

  • Is there other more explicitly-connected data I could be looking at?
  • I'm having some technical issues connecting with the BLS.gov api. Could use some technical assistance.
  • Is there a way I can use a service like Taskrabbit to collect data? It that too weird?
  • How do these services affect the current part-time migrant labor community?

Image Tiling Framework:

Based on feedback, I spent some time on Friday working on some basic shape and color parametric manipulation tools in Processing. The goal is to be able to iterate quickly and output high-quality PDFs. See it in action here. Output examples below:

Creative Code Fellowship Week 1: Planning!

Yesterday I started the Creative Code Fellowship Program. I can already see what an amazing framework of support Gray Area and Stamen have put together for the fellowship participants. 

What's THE main idea?
Create fabrics, with the look of Dutch Wax Block Prints (popular in West Africa), that use symbology to communicate the prevalence, contrasts, and/or frictions of rapid change as it affects parallel lives in the Bay Area. The background textures of the fabrics will be generativity constructed using data related to the chosen pattern topic.     WORKING TITLE: BAY DATA FABRICS

original proposal and block print examples

more block print examples

The timeline for my project is really short! It's especially short if I want to get fabrics printed and clothing tailored by the August 26th presentation date. I really want use an analog printing process but research is showing that I may have to go with a digital printing process just to stay on schedule.


Here's a rough timeline to start:
 

June 11th - July 16th: 

  • Determine themes
  • Find data 
  • Drawing, Create patterns (4-5) 
  • PAOM and Spoonflower tests
  • Seek tailor

July 16th - July 30th: 

  • Fabric printing
  • Start QR/Web element

July 31st - August 20th: 

  • Clothing tailored
  • QR/Web element

I've already considered and researched some printing options:

Printing lead times:

  • Spoonflower: 7-9 days + shipping (leaning to using this service)
  • PAOM: 2-4 weeks for production.
  • Zoo Ink (screenprint): up to 4 weeks, already taking orders for July
  • Print myself….? CNC Wood Blocks.

What are my data fabric themes? I hope to choose 4 to 5


What kinds of background patterns will I use to encode the data? See the sketchbook

Questions

  • Should I print the fabric by analog process or digital? (Leaning digital due to time constraints) Production ideas?
  • Should I have the clothing custom tailored?  Where?
    (Leaning to yes. Still need to decide on patterns and tailor)
  • How many different patterns and topics should I pursue? 
        (leaning to 4, maybe 5)
  • Data sources?
  • Which themes are the strongest? which should I start with? (leaning to yes)
  • What does the fabric identification system look like?  http://www.qr-code-generator.com/ 
  • Should some designs could be completely abstract (but still based on data)?
  • Should patterns be parametric with many variations?
  • How can I bring something new to the “changes in San Francisco” dialogue?
  • Long term: What happens with the fabric and/or clothing? Sale to benefit local organization?

Other Thoughts:

  • Work fabrics and data like paintings and drawing. Layering, depth of color and texture.
  • How to make the images look like they were block printed?
  • Limited palette